Topic: Data & Analytics

  • RECORDING: Citrus Analytics – Turn on Your Analytical Superpowers!

    RECORDING: Citrus Analytics – Turn on Your Analytical Superpowers!

    Please join us as we welcome Citrus Analytics to present this 30-min Pitch Perfect. 

    In this live demo, you’ll see Fusion — the AI-native platform for quantitative survey analysis — work through a real dataset from start to finished report.

    What you’ll see:

    • A full end-to-end analysis run live — import, analysis plan, insights, visualisation, report
    • Advanced methods (including Relative Weight Analysis) executed in minutes, not hours
    • How Fusion finds patterns and insights a manual workflow would likely miss
    • Why Fusion uses real statistics and ML libraries — not a general-purpose LLM
    • How your data stays secure inside the platform throughout

    Why attend:

    • You do quantitative research and spend too much time on the mechanics of analysis
    • You want to see AI applied to survey data in a rigorous, methodologically sound way — not a chatbot demo
    • You’re curious whether a 200–500% productivity gain is real. It is. Come see for yourself.

    About Citrus Analytics

    Citrus Analytics is the company behind Fusion — an AI-native platform built specifically for quantitative survey analysis. Founded by market research veterans and data scientists, Citrus was created to solve the problems analysts face every day: too little time, too many manual steps, and too many insights left undiscovered.

    Fusion is built on real statistical methods, machine learning, and data visualization libraries — not a general-purpose LLM. It works with respondent-level raw data, covers 100+ analytical methods, and keeps your data secure inside the platform throughout. The result: a three-hour job done in 30 minutes, with more insights found and a finished report ready to share.

    Citrus Analytics is backed by Opinion — Norway’s largest market research agency, with 35+ years of industry experience — which serves as both anchor client and industrial validator of the platform.

    About the Presenter — Ole Petter Nyhaug

    Ole Petter Nyhaug is CEO and co-founder of Citrus Analytics, the company behind Fusion. He has 25+ years of experience as an analyst, consultant, and entrepreneur in the market research industry — including a global business development role and two successful tech-driven research company exits. Ole Petter built Fusion together with Opinion to solve the problems he spent decades watching analysts struggle with: too little time, too many manual steps, and too many missed insights.


    Ole Petter Nyhaug | LinkedIn

    Ole Petter Nyhaug <olepetter@opinion.no>

    Watch this session here

    Claim your free demo of the software here (email Ole, above)

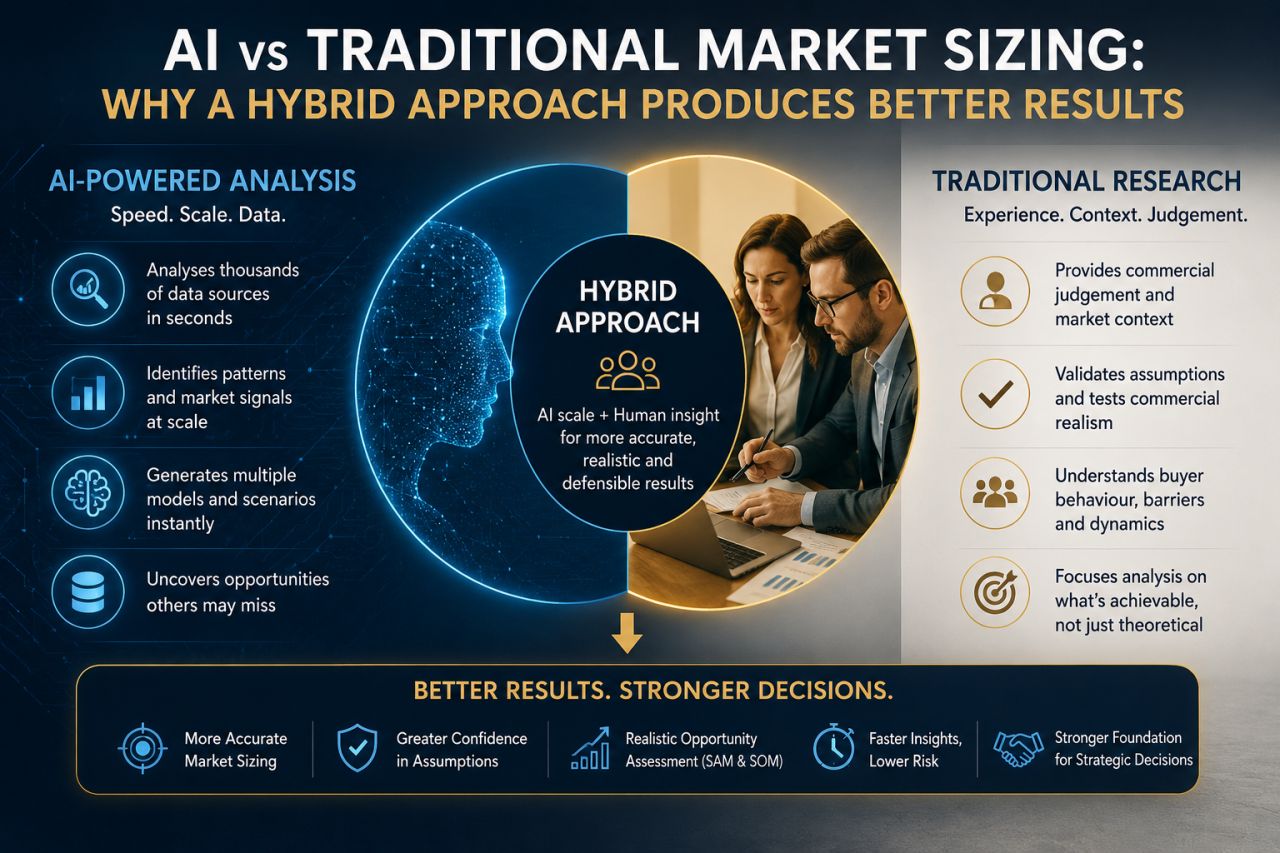
  • Market Sizing – Why a Hybrid Approach Produces Better Results

    Market Sizing – Why a Hybrid Approach Produces Better Results

    Article by ICG member Kevin Simmonds, Advantage Market Intelligence UK & Peru


    Artificial intelligence is transforming market sizing and market research, but AI alone cannot determine whether an opportunity is commercially achievable.

    This article (below) explores why combining AI-powered market analysis with expert human validation delivers more accurate TAM, SAM and SOM assessments. Learn how a hybrid Human + AI approach improves market opportunity assessment, reduces uncertainty, and supports better strategic decision-making.

    Full Article

    Kevin Simmonds | LinkedIn

  • Citrus Analytics: Turn On Your Analytical Superpowers

    Citrus Analytics: Turn On Your Analytical Superpowers

    Please join us as we welcome Citrus Analytics to present this 30-min Pitch Perfect.  In this live demo, you’ll see Fusion — the AI-native platform for quantitative survey analysis — work through a real dataset from start to finished report. What you’ll see:
    • A full end-to-end analysis run live — import, analysis plan, insights, visualisation, report
    • Advanced methods (including Relative Weight Analysis) executed in minutes, not hours
    • How Fusion finds patterns and insights a manual workflow would likely miss
    • Why Fusion uses real statistics and ML libraries — not a general-purpose LLM
    • How your data stays secure inside the platform throughout
    Why attend:
    • You do quantitative research and spend too much time on the mechanics of analysis
    • You want to see AI applied to survey data in a rigorous, methodologically sound way — not a chatbot demo
    • You’re curious whether a 200–500% productivity gain is real. It is. Come see for yourself.
    About Citrus Analytics Citrus Analytics is the company behind Fusion — an AI-native platform built specifically for quantitative survey analysis. Founded by market research veterans and data scientists, Citrus was created to solve the problems analysts face every day: too little time, too many manual steps, and too many insights left undiscovered. Fusion is built on real statistical methods, machine learning, and data visualization libraries — not a general-purpose LLM. It works with respondent-level raw data, covers 100+ analytical methods, and keeps your data secure inside the platform throughout. The result: a three-hour job done in 30 minutes, with more insights found and a finished report ready to share. Citrus Analytics is backed by Opinion — Norway’s largest market research agency, with 35+ years of industry experience — which serves as both anchor client and industrial validator of the platform. About the Presenter — Ole Petter Nyhaug Ole Petter Nyhaug is CEO and co-founder of Citrus Analytics, the company behind Fusion. He has 25+ years of experience as an analyst, consultant, and entrepreneur in the market research industry — including a global business development role and two successful tech-driven research company exits. Ole Petter built Fusion together with Opinion to solve the problems he spent decades watching analysts struggle with: too little time, too many manual steps, and too many missed insights. Ole Petter Nyhaug | LinkedIn

    Register your place 

  • Using AI Agents with Survey Data: Six Principles for Getting It Right

    Using AI Agents with Survey Data: Six Principles for Getting It Right

    Article by ICG member Matt Gibbs

    A practical guide for insights leaders evaluating agentic AI solutions

    We’re increasingly hearing the question: can’t I just drop survey and insights data into ChatGPT, Claude, or Copilot?  The short answer: Yes, you can. But you’ll encounter serious problems with data security, numerical accuracy, and analytical consistency.  Having spent the past few years building agentic systems specifically for market research, I’ve learned what works and what doesn’t. Here are six principles that should guide any implementation.

    1. Keep Your Data Out of Public Endpoints

    As soon as you paste data into a public model endpoint, you lose control. You cannot govern what it may be used to train, who may access it, where it’s stored, or for how long. This is likely to breach data processing agreements and industry codes of conduct.  Quant or Qual, the answer is the same.

    The right approach: Any implementation must use isolated model instances within a controlled cloud environment, ideally inheriting enterprise security architecture from one of the big providers like Microsoft or AWS. Data should remain within defined boundaries, with demonstrable compliance.

    2. Never Let the Model “See” Raw Numbers

    When you paste data into a chat model, everything becomes tokens. The model doesn’t compute statistics. It predicts what plausible-looking numbers might be.  This leads to percentages that don’t sum correctly, fabricated base sizes, “insights” that contradict the actual data, and no provenance. You simply cannot verify where a number came from.

    The right approach: The model should never consume raw data as tokens. Instead, give it access to tabulation engines and insights tools tested in the real-world of market research for decades.   That way the model can compute exact figures on demand. When an agent reports “32% of prospects are aware of Brand X,” that number should come from a validated statistical computation, not a language model estimate. Every insight must trace back to a reproducible run, auditable by design.

    3. Preserve Your Curated Table Libraries

    Research teams invest significant effort building validated table specifications: the correct variables, consistent filtering, proper weighting, meaningful labels. Dropping raw data into a generic chat model discards all that intellectual property.

    The right approach: Build systems where the agent can search and run from a library of pre-built, validated table specs. Any data point should be traceable to source. Better yet, enable the system to discover what analysis has been done before through conversation history at the organisational level. This institutional knowledge compounds over time.

    4. Demand Statistical Rigour

    Survey analysis requires demographic weighting, subgroup filters, and significance testing. Chat models have no native capacity for applying weighting schemes consistently, filtering to target populations, calculating statistical significance between groups, or warning when base sizes are too small to report. These are language models, not statistical engines. They cannot reliably execute the same analysis twice.

    The right approach: Combine dynamic spec generation by models with a proper cross-tabulation engine producing the numbers. Users should be able to instruct in conversational English, with models generating the coding syntax and passing it to a validated engine. The statistical computation must be deterministic and reproducible.

    5. Embed Sector-Specific Expertise

    Generic chat models know nothing about your organisation, your sector, or your projects. Every conversation starts from zero.

    The right approach: Build contextual understanding into the system. The agent should know your organisation, your projects, your data structure, and your previous analyses. Embed sector-specific expertise that creates organisational “common sense.”  Pre-built workflows should exist for common research tasks: segmentation, TURF analysis, correspondence mapping, brand tracking, verbatim coding, strategic reports. These encode lessons from years of practice. Multiple team members should receive consistent analysis approaches, not whatever the model happens to generate that day.

    6. Optimise for Speed to Insight

    Using a raw model for survey analysis requires extensive prompt engineering, data formatting, and manual verification. Not every stakeholder who needs insight has time to coach a model into usefulness, repeatedly, across every conversation.

    The right approach: Eliminate ramp-up time. Analysts shouldn’t need to re-explain data structures, variable names, or project context. Pre-built table libraries should mean common questions resolve in seconds, not hours. Outputs should be client-ready: branded presentations, interactive dashboards, and web visualisations, not chat text that needs reformatting.  Most importantly, implement MR-grade guardrails. The system should refuse to fabricate quotes, validate numbers against source tables, use hedged language appropriately, and separate technical statistics from executive summaries.

    Beyond Pre-Built Workflows

    The most powerful implementations give the model access to a full coding environment within a secure, isolated workspace. Users can request bespoke analyses, custom visualisations, or entirely new tools simply by describing what they need in plain English. The agent writes and executes code on the user’s behalf. This means an insights director can say “build me an interactive dashboard showing brand health over time with drill-down by region” and receive a working application, not a description of how one might be built. The same applies to statistical analyses that don’t fit pre-packaged workflows, custom data transformations, or one-off client deliverables.

    This is the emerging capability of agentic software: code generation orchestrated by conversation, constrained by guardrails, and delivered within a controlled environment. The opportunity is to provide this capability to research teams without requiring them to become programmers.

    Summary

    Raw AI gives you a conversation. A properly architected agentic system gives you a research capability.  The model is the easy part. The tooling around it is where value is created. The questions that serious insights directors should be asking of any solution are:

    1. Where does my data go, and who controls it?
    2. How are numbers computed, and can I trace them to source?
    3. Does the system understand my existing analysis, or do I start fresh each time?
    4. What safeguards prevent fabricated insights reaching stakeholders?

    Any solution worth considering should answer these questions with confidence.

    Market research has built its reputation on transparent methodology and data governance over decades. If a significant portion of our sector begins using public AI models without safeguards, we don’t just risk individual credibility, we risk the trust that underpins the entire industry.  There are tools that can help.  Tools that are designed to serve our professions. Please use them.

    Matthew Gibbs | LinkedIn

  • RECORDING: Transform Historical Research Data into Compelling New Stories

    RECORDING: Transform Historical Research Data into Compelling New Stories

    In this session hosted by QuestionPro’s Senior Account Manger Oku Egho, you’ll learn how to add multiple surveys onto their intuitive data visualisation and charting platform, Business Intelligence. If you’re struggling with limited funds, why not utilise existing survey data and create engaging new infographics, splicing data to produce narratives that will cut-through to give your customers that competitive edge.

    What you’ll learn 

    • Create interactive Data Vis to help showcase data and tell engaging stories
    • Build dashboards from multiple surveys in minutes not hours
    • Utilise smart widgets and fully customisable dashboards to build baseline reports representative of your brand
    • Take advantage of our exclusive 20% discount for ICG members

    Our Speaker – Oku Egho Senior Account Manager, QuestionPro

    A dynamic, accomplished customer-centric Account Manager who’s spent the past 5 years at QuestionPro helping researchers, independent consultants and enterprise clients excel in understanding their markets, making better informed decisions whilst addressing complex insight projects.


    Online Survey Software and Tools | QuestionPro

    (5) Oku Egho | LinkedIn

    Watch this session here 

  • Small But Mighty – Large Scale Reporting With Lean Resources

    Small But Mighty – Large Scale Reporting With Lean Resources

    In this case study Lunch&Learn, ICG Member Paul Carney of ClearCut Insights shares how he used automation – transforming what is traditionally a time-intensive reporting challenge into a streamlined, repeatable process with standout results. For smaller companies and independent market researchers who are juggling delivery, analysis and client expectations, reporting often becomes the biggest bottleneck. In this session, you’ll discover how automation can fundamentally supercharge the way PowerPoint and Google Slides reports are created – moving from arduous, manual slide building, to faster, more consistent, insight-led outputs, generated directly from original data sources. Automation is not just about saving hours (though you absolutely will). It is about:

    • Eliminating manual errors and last-minute fixes
    • Reusing templates easily across markets, waves and data cuts/segments
    • Freeing up time for interpretation, recommendations and more analysis/insights
    • Delivering polished, scalable outputs in a fraction of the time without needing a larger team

    If reporting is eating into your time, this session is for you.

    We would love to have you join us.

    Speakers:  Benjamin Rietti, CEO, E-Tabs Benjamin Rietti is the CEO of E-Tabs. His innovative approach has seen the company provide reporting services and solutions to the MR industry for over 30 years. With over two decades of industry knowledge, Benjamin is a talented entrepreneur who recognises the integral role technology plays in market research. A doting family man, he enjoys spending time with his children and grandchildren and has a passion for skiing. https://www.e-tabs.com/    linkedin.com/in/benjaminrietti Paul Carney, Owner, ClearCut Insights Paul has over 25 years of experience in designing, running and deploying multi-country segmentations into some of the world’s largest organisations. He has run Research International’s Marketing Science Centre, was Managing Director of Bonamy Finch, and most recently, was a board member of STRAT7, and a Partner in their Advisory team. Paul set up ClearCut in 2024 to work more closely with client teams on building and embedding strategic segmentations. https://theicg.co.uk/member/paulclearcut-insights-com/ About E-Tabs: E-Tabs has been providing award-winning, leading data visualization and reporting solutions to the market research industry for over 30 years. We help businesses all over the globe boost their productivity and engagement by making the process of producing their reports and visualizations quick, simple and cost effective. E-Tabs – Global Report Automation Leaders

    Register your place here 

  • The Symphony within the Data – Composing Insights with AI

    The Symphony within the Data – Composing Insights with AI

    Article by ICG member Arthur Fletcher


    Using Collaborative AI* to produce a research report is, in many ways, like composing a beautiful symphony.

    It begins with the interviews themselves: the raw conversations, the stories, the hesitations, the sparks of emotion. These are your musical materials – keys, chords, motifs, riffs and phrases.  Each participant offers a new timbre, a different rhythm, a subtle variation on the theme.  By the time fieldwork ends, you have an orchestra’s worth of material waiting to be shaped.

    For a typical AI analysis, the next step is an analysis plan: an executive summary, a thematic breakdown, key quotes, implications etc.  This is immensely valuable but it can feel like a pianola roll – a predetermined script that produces a pleasant, recognisable tune.  It follows familiar combinations and harmonic progressions and it gets the job done but it is not yet a symphony. It has form, but not soul.

    This is where Collaborative AI changes the creative atmosphere.

    The AI takes that pianola roll – the structure, the patterns, the first implications – and lays it out clearly.  Then, like a composer settling at the piano, you begin to explore. You start asking questions of your data:

    “What happens if I follow this theme?”

    “Where does this emotional progression lead?”

    “What is the story hiding beneath this discord?”

    The AI listens, responds and plays back possibilities.  It doesn’t invent notes that were never played, it helps you uncover the melodies the data is already singing.  It can isolate a phrase from one interview, harmonise it with a counter-theme from another or spotlight a discord that demands resolution.  It allows you to roam through your material with freedom, curiosity and confidence, guided but never constrained.

    Slowly, the music becomes richer.  Insights that were once scattered become aligned. Subtle tensions resolve into understanding.  A fleeting remark becomes the emotional centrepiece of the movement.  What began as raw notes and mechanical playback transforms into something shaped by instinct, interpretation and craft.

    And then – almost imperceptibly – the final composition emerges.

    Not a machine-generated tune, not a formulaic analysis but a symphony – layered, resonant, human in its sensitivity and unmistakably yours.

    Collaborative AI does not replace the researcher, it accompanies them.  It provides the structure of the composition, the clarity of the score and the responsiveness of an intuitive musical partner.  But the symphony – the insight, the narrative arc, the emotional truth – is composed by the human hand.

    In this way, Collaborative AI doesn’t diminish the artistry of qualitative research.  It amplifies it, offering researchers the chance to move beyond mechanical summaries and into the realm of genuine creative interpretation.

    Because when AI and researcher compose together, insight can finally sound as beautiful, as powerful, and as unforgettable as music.

    If you would like to know more about Collaborative AI*, please get in touch.

    *’Collaborative AI’ is a term I’ve coined to describe an AI that works with the researcher rather than in their place – an intelligence that supports, clarifies and elevates human interpretation while remaining absolutely faithful to the data.

    AI also helped me to create this article.

    Arthur Fletcher | LinkedIn

  • RECORDING: Data Protection 2025 – New Rules/New Risks

    RECORDING: Data Protection 2025 – New Rules/New Risks

    This Knowledge Share has been generously sponsored by Indeemo.


    The Knowledge Share will be run by ICG member Jude Legg, and will aim to update members on what’s new in the world of data protection and offer some practical tips to maintain compliance.

    Jude Legg

    I have over 20 years experience working in the market research industry. I started with a brief cameo as a qual research exec, then moved into Field & Project Management then latterly into compliance. I became a self employed compliance consultant in January 2024 and I am a certified data protection professional.

    https://www.linkedin.com/in/jude-legg-9243064/

    Watch this session here 

    Session slides here

  • RECORDING: Beyond synthetic: The irreplaceable value of face-to-face data collection

    RECORDING: Beyond synthetic: The irreplaceable value of face-to-face data collection


    “In a world racing toward artificial data, what’s the real cost of losing human connection?”

    Michael Pollock from StreetLife draws on 30+ years of face-to-face quantitative research to explore:

    • The Face-to-Face Evolution

    “How quant face-to-face has transformed in 5 years”

    • The Niche Advantage

    “Do specialists outperform generic approaches?”

    • Real vs. Synthetic

    “What only human interaction provides”

    • Closing & Q&A


    Michael Pollock 

    Michael is a Director of StreetLife, a leading UK-based fieldwork agency specialising in quantitative face-to-face market research. The company has operations in Bexleyheath, Kent, and Manchester, alongside regional hubs right across the UK.  Since its establishment in 2011, StreetLife has provided UK and global companies with a wide range of fieldwork services, including exit interviews, central location tests, in-home interviewing, mystery shopping, and door-to-door and on-street interviews.


    StreetLife

    Watch this session here

  • RECORDING: Turn Raw Survey Data into Visual Story Dashboards—Narrated by Researchers

    RECORDING: Turn Raw Survey Data into Visual Story Dashboards—Narrated by Researchers

    A Lunch&Learn session with ICG member Ange Taylor, AddMaple

    Most insights land in tables clients can’t explore – the endless scroll. PowerPoint slides are polished, but can’t be explored. Follow-up requests keep coming: “Can we see this by region? Gender? Just new customers?” Meanwhile, researchers rarely get credit for the insights that drive awards and impact .

    Imagine this instead:
    Researchers leap from raw survey data to a story dashboard – charts, qual themes, key drivers, stats, and tables, empowered with automated key driver analysis as they explore and craft the data story. You save remarkable charts while you explore and ask our AI agent what is unexpected or interesting and have it help you add charts and text to the story dashboard you can edit. You dear researcher record short videos, for specific pages, to add richness. Once story dashboards are delivered, they enable clients to learn from your framing but can also ask their own questions, and make their own cuts. A dashboard that’s explorable, beautiful, and puts your voice at the centre – even after handover.

    What you’ll learn:
    Ange will demo this using raw ICG Census data—showing how to build dashboards that let researchers guide the narrative, add meaning with images or short video, and highlight what matters most. With thanks to Ramona, Nadia, Arthur, and the Census team.

    AI – isn’t this a threat and a hallucination risk?
    AddMaple uses AI to accelerate what can be sped up – coding open ends and surfacing the remarkable patterns that AddMaple’s proprietary stats engine found through programmatic sequential testing. A tag team between a powerful stats engine and AI – this keeps our AI features in check.

    Watch this session here